What is the equation of the graph shown?
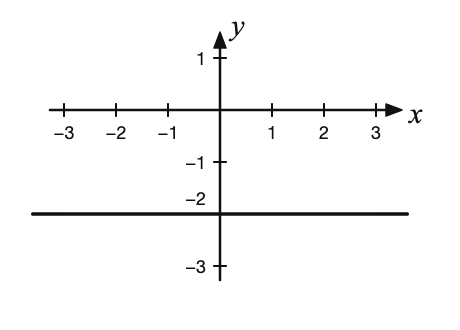
- y = -2.
- x = -2.
- y = 2x.
Explanation from PART66Online
The graph is a horizontal straight line that crosses the y-axis at -2. Every point on it has y = -2, whatever the value of x, so its equation is y = -2. x = -2 would be a vertical line crossing the x-axis at -2, and y = 2x is a sloping line through the origin.
S
Slick Rick 88 asked · 18 Feb 2020
It shouldn't be y=2?
Community Comments (1)
C
Carlotambo66
18 Jan 2021
because if you look the straight line with the x on final, that's the y=0 and the equation the the question in talking about is the line under the x line
Please Sign In to post a comment.
More discussions in 1. Mathematics
- The plot of the equation y = 1/x is a
- Which of the graphs shown is given by the equation y = x^2 + 3?
- Which of the graphs shown is given by the equation; y = 2x^3 + 4x + 3?
- Cos A =
- A sector with angle A is subtended to the centre point of a circle. Area of the sector is proportional to
- Starting from zero amplitude, the cosine curve repeats itself between