Which of the graphs shown is given by the equation y = x^2 + 3?
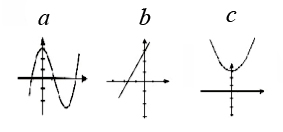
- a
- b
- c
luketomkins23 asking:
can someone explain this to me
Community Comments (1)
C
cptjacob Posts: 5 15.08.2018 / 16:43
First graph is cosinus function, middle is linear y=ax+b something more like (y=3/2x+3) enter it to Google to check, and the last one is parabola (square function) y=ax^2+bx+c which here is simplified to form y=ax^2+b look up to khanacadamy.com
Please Sign In to post a comment.